


When your SaaS platform starts to falter, it’s often due to four key issues: performance, user experience, scalability, and security. These challenges can lead to slow systems, frustrated users, and revenue loss. Here's how to address them effectively:
- Performance Fixes: Use monitoring tools (like New Relic or PagerDuty) for real-time insights, run load tests to identify bottlenecks, and optimize slow database queries with indexing, caching, and efficient code.
- User Experience Improvements: Analyze user behavior with heatmaps and session replays (via tools like Hotjar). Conduct A/B testing to refine design and use feedback to fix pain points.
- Scalability Solutions: Scale horizontally with stateless architecture and containerization (using Kubernetes). Optimize databases with sharding and integrate CDNs to handle traffic spikes.
- Security Enhancements: Manage risks with IAM protocols (e.g., SSO, MFA), secure APIs, and monitor configurations with SSPM tools.
For struggling SaaS platforms, prioritizing these areas can stabilize performance, retain users, and prepare for growth. Partnering with experts like Scimus can accelerate recovery through tailored QA services and code audits.
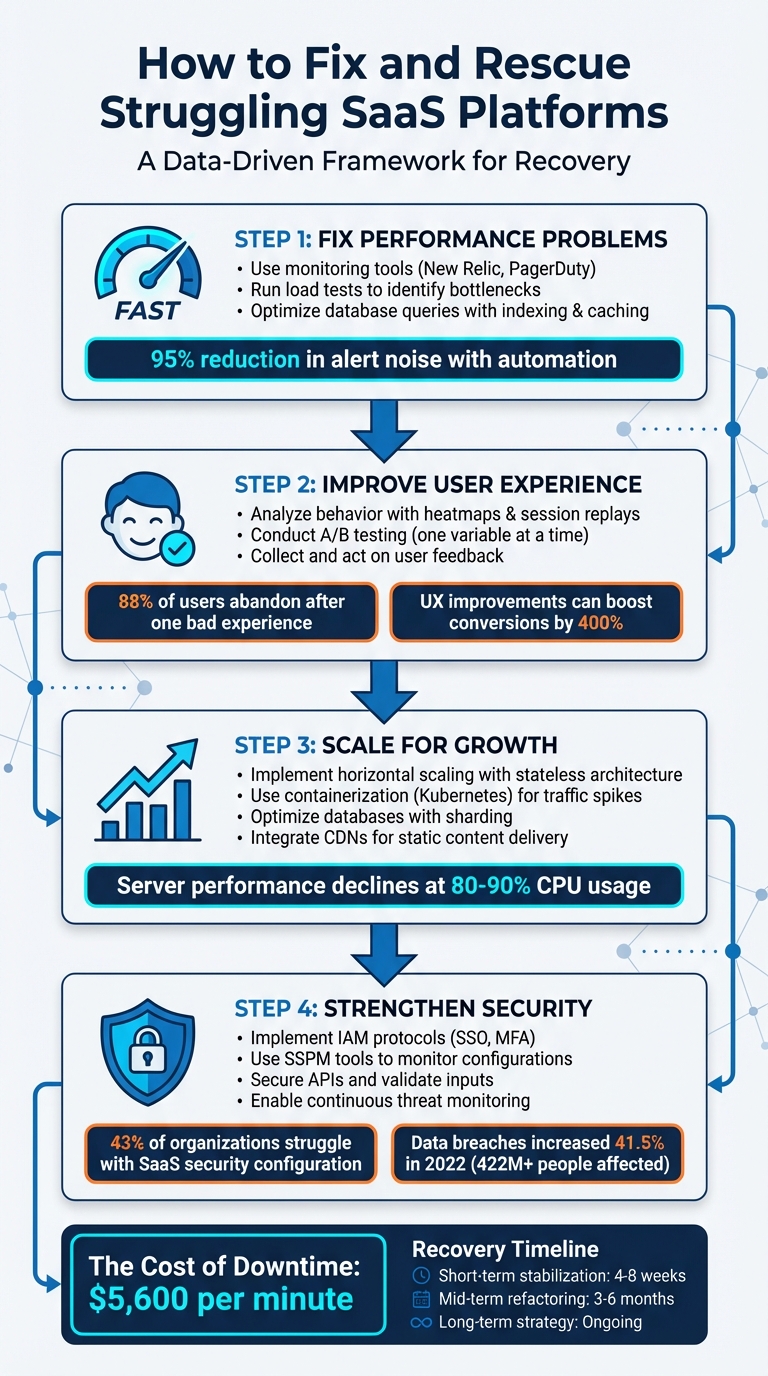
4-Step Framework for Rescuing Struggling SaaS Platforms
The 7 Costliest SaaS Mistakes & The Truths About Multi-Cloud
Finding and Fixing Performance Problems
Tackling performance problems is critical to keeping your SaaS platform running smoothly. Diagnosing these issues requires a methodical approach to avoid wasting resources. The secret lies in using the right tools and strategies to identify exactly where your platform is falling short.
Using Monitoring Tools for Real-Time Insights
Monitoring tools are invaluable for keeping tabs on your platform's performance. They focus on three main areas: backend operations, network performance, and client-side rendering. These tools work by installing language-specific agents that gather performance metrics and send them to a centralized dashboard. Key metrics include latency, throughput, error rates, and resource usage.
Some tools take it further with machine learning features that reduce alert noise. For instance, BigPanda can cut down alert noise by up to 95%, while PagerDuty reports an 87% reduction thanks to its automation platform. New Relic even offers new users 100 GB of free monthly data ingestion.
To make the most of these tools, set up deployment markers to log every code change. This helps you quickly spot if a release impacts performance. Use dynamic thresholds that adapt to traffic patterns and prioritize monitoring critical transactions like "Login" or "Checkout." Once real-time monitoring is set, you can run load tests to uncover hidden bottlenecks.
Running Load Tests and Stress Tests
Load testing is a proactive way to simulate peak traffic conditions before they occur, helping you identify scalability issues and improve performance. On the other hand, stress testing pushes your platform beyond normal limits to find the exact point where performance starts to break down.
A good starting point is simulating five concurrent users for one hour, then gradually adding five more users every 15 seconds. Keep an eye on the 95th percentile of response times, as problems can arise even when hardware usage is only at 70%.
"The key part of this test is identifying the first bottleneck. You don't need to worry about what's happening in the chart after the first bottleneck - anything beyond that point is just a symptom that you should differentiate from root causes." - Rebecca Clinard, Solutions Consultant, New Relic
When testing, change only one variable at a time - whether it's adding CPU cores, increasing JVM heap size, or adjusting connection pool limits. This ensures you can clearly measure the impact of each change. Also, keep in mind that even cloud platforms, which seem infinitely scalable, have service quotas that can cause unexpected failures during high-demand periods.
After identifying where load-related problems occur, dive deeper into your database and code to address inefficiencies.
Finding Slow Database Queries and Inefficient Code
Database performance often plays a big role in SaaS platform slowdowns. Using APM agents, you can gather real-time data on transaction times, query durations, and external service calls. Focus on queries that consume the most time overall, as even moderately slow queries can have a massive impact if executed frequently.
Run EXPLAIN or EXPLAIN ANALYZE on slow queries to uncover issues like full table scans, missing indexes, or inefficient joins. Address these by adding indexes, optimizing joins, and using connection pooling tools like pgbouncer (PostgreSQL) or ProxySQL (MySQL) to prevent "connection storms" that overwhelm the database. You can also add read replicas to handle heavy read traffic and implement caching solutions like Redis to store frequently accessed but rarely updated data.
Frontend performance matters too. If the time to first byte (TTFB) exceeds 0.5 seconds at the 75th percentile, it likely points to backend delays. Use timeouts and circuit breakers for external API calls to ensure one slow third-party service doesn’t drag down your entire platform. Additionally, in virtualized environments, watch out for "CPU stealing", where your resources are diverted to other tenants. Pinning critical containers to dedicated CPU cores can help mitigate this.
For microservices architectures, distributed tracing is a must. It allows you to track a single request as it moves through multiple services, helping you pinpoint exactly where delays occur.
Improving User Experience to Keep Customers
Even the best-performing platforms fall short if they frustrate users - 88% of people will abandon a product after just one bad experience. Making structured improvements to user experience (UX) can boost conversion rates by as much as 400%. Tools like visual analytics and direct user feedback make it easier to refine interactions and keep customers engaged.
Using Heatmaps and Session Replays
Heatmaps and session replays are invaluable for spotting where users encounter problems on your platform. Heatmaps provide color-coded visuals that show where users click, scroll, and move their cursors. Session replays, on the other hand, are like video recordings of user sessions, capturing moments of hesitation, frustration, or abandonment.
Look for "rage clicks", where users repeatedly click on an unresponsive element, signaling a broken feature or a slow response. Another common issue is "dead clicks", which occur when users mistakenly interact with non-clickable elements, creating unnecessary friction. Session replays can also highlight "U-turns", where users quickly backtrack to a previous page because the current one didn’t meet their expectations.
"Session recordings can work well with product engagement analytics to provide more detailed information... engagement analytics can tell how many product clicks happened per session, but session recordings make you see the reason for the clicks." - Userpilot
To address these issues, filter session replays to focus on friction behaviors like rage clicks or abandoned carts. Combine heatmap data, which shows what elements users ignore, with session replays, which reveal why they’re ignored, for a complete picture. Tools like Hotjar and UXCam offer free recording options - Hotjar provides 500 daily recordings, while UXCam includes 3,000 monthly sessions. Use these insights to guide targeted A/B testing and refine your design.
A/B Testing for Better Design Choices
A/B testing turns user behavior insights into measurable design improvements. By testing one variable at a time - such as a button color or headline - you can clearly see how the change impacts user behavior. Testing multiple elements at once requires more traffic and makes analysis more complex.
Start by using data from heatmaps, exit surveys, and session replays to identify problem areas. For example, if heatmaps show users aren’t scrolling far enough to see your call-to-action button, try moving it higher on the page. Track a primary metric, like click-through rate, alongside "guardrail" metrics, such as retention or average order value, to ensure your changes don’t negatively affect other business goals.
It’s essential to run tests long enough to account for traffic fluctuations and patterns over time. Aim for a 95% confidence level to ensure your results are statistically reliable. Keep in mind that only about 1 in 7 A/B tests will yield a clear winner, so focus on high-impact elements like headlines, above-the-fold content, and pricing displays.
Redesigning Interfaces Based on User Feedback
User feedback is a direct line to understanding what’s broken and what users need. Gather feedback through in-app surveys, support tickets, and social media to uncover pain points and guide interface redesigns. Use quantitative tools like Net Promoter Score (NPS) and Customer Satisfaction (CSAT) surveys alongside qualitative interviews to get a full picture of user issues.
Create a "friction log" to document user challenges, categorizing them as either "function friction" (tasks users can’t complete) or "opportunity friction" (gaps between user needs and platform capabilities). Prioritize fixes based on severity: Critical issues block tasks entirely, Serious issues cause frustration or abandonment, and Minor issues, while less urgent, still impact the experience.
"User feedback in customer-centric companies is the fuel that drives every internal working part." - Noah Shrader, Product Designer
Keep in-app surveys brief - just one or two questions - and trigger them after users complete key actions, like making a purchase or trying a new feature. Avoid leading questions and stick to neutral phrasing, such as "How would you rate the checkout process?" instead of "Did you find the checkout process confusing?". Segment feedback by user type - like power users or churned users - to better understand how different groups experience your platform.
Scaling Your SaaS Platform for More Users
As your SaaS platform gains popularity, maintaining performance becomes a challenge. Server performance often starts to decline when CPU usage hits 80%–90%, signaling the need to scale. Increased user demand inevitably brings scaling issues, but there are practical ways to handle them effectively.
Using Horizontal and Vertical Scaling
Scaling can be approached in two ways: vertical scaling and horizontal scaling. Vertical scaling involves upgrading a single server by adding more CPU, RAM, or disk space. However, this method has its limits since hardware can only be improved to a certain extent. On the other hand, horizontal scaling adds more server instances to share the workload. For this to work, your application must be stateless, meaning any instance can handle any request without relying on others.
"Scaling out doesn't fix every performance issue. For example, if your backend database is the bottleneck, it doesn't help to add more web servers." - Microsoft Azure
Horizontal scaling is often the better long-term strategy for SaaS platforms because it ensures high availability. If one instance fails, others can continue handling requests. However, relational databases, which can be harder to rework, may require vertical scaling or sharding to scale effectively. Automating scaling with Infrastructure as Code (IaC) can also help your platform adjust to demand changes without manual input.
Optimizing Databases and Adding CDN Integration
As traffic grows, databases often become the bottleneck. Techniques like sharding (splitting data across multiple databases with the same structure) can help balance the load and prevent a single point of failure. Another approach is vertical partitioning, which separates data fields based on how frequently they’re accessed - for instance, moving frequently used fields to their own storage.
To identify database issues, monitor metrics like total logical reads and execution plans. Disk I/O wait times exceeding 15 milliseconds often indicate strain. Fragmented indexes can also slow performance - reorganize them if fragmentation is under 30%, or rebuild them if it exceeds 30%.
Content Delivery Networks (CDNs) are another essential tool. By serving static files (like images, CSS, and JavaScript) from servers closer to your users, CDNs reduce the load on your origin server. Use Gzip compression to shrink text-based resources by up to 70%. For caching, set headers like Cache-Control: public with a Time To Live (TTL) of one year for static content and around three hours for dynamic content. Image CDNs can further optimize performance by resizing and compressing media automatically. For animated content, MP4 is a better choice than GIF due to its smaller size.
To safeguard your infrastructure during traffic surges, implement rate limiting through a load balancer, reverse proxy, or CDN. Avoid putting complex business logic in your database - let it focus on storing and retrieving data efficiently. Beyond database optimizations, containerization offers a flexible way to handle spikes in demand.
Using Containerization for Traffic Spikes
Containerization packages your application and its dependencies into portable units, making it easier to scale and deploy. Tools like Kubernetes can automate the management of containerized workloads, offering features like self-healing (restarting failed containers) and rapid scaling during traffic spikes. Kubernetes can launch new containers in seconds, ensuring your platform can handle sudden increases in demand.
To make the most of containerization, design your app to be stateless, so any container can process requests without relying on others. Breaking your application into microservices can also help. For instance, instead of scaling the entire platform, you can scale only the components experiencing high demand, like payment processing or search services.
Using lightweight base images can speed up container deployment by reducing image size. Set clear auto-scaling triggers, such as adding a new instance when CPU usage exceeds 75% for a sustained period. To avoid delays during spikes, pre-initialize nodes or use provisioned concurrency to minimize "cold start" lag.
Regular stress testing with tools like Apache JMeter, k6, or Gatling is essential. These tools simulate thousands of users to identify bottlenecks before they impact real customers. Even with effective container scaling, databases can still become a weak point. To address this, use read replicas, sharding, and caching solutions like Redis or Memcached to ensure your data layer scales as effectively as your application layer.
Be aware that certain cloud services, like API Management instances, can take up to 45 minutes to scale. Plan ahead for expected traffic spikes instead of waiting for performance to falter. Also, monitor your costs carefully - cloud providers often offer discounts, such as up to 72% savings with reserved instances or up to 90% off with spot instances, which can help control expenses as you scale.
sbb-itb-116e29a
Working with Scimus for QA Outsourcing and Code Audits
If your SaaS platform is facing challenges, taking a methodical, data-driven approach is essential. IT downtime can cost an average of $5,600 per minute, so diagnosing and stabilizing issues quickly isn’t just important - it’s critical. As discussed earlier, accurate monitoring and user behavior analysis are key components of recovery. Scimus enhances these efforts by offering specialized QA and audit services that replace guesswork with actionable insights. These services integrate smoothly into broader strategies, helping SaaS platforms recover and prepare for the future.
Partnering with Scimus for Quality Assurance
Scimus provides QA services designed to catch problems before they hit production. By integrating CI/CD pipelines and automated testing, they help establish "Quality Ops" ownership - a disciplined process that minimizes the risk of bugs making their way into live environments. Testing APIs and components from the very beginning delivers measurable results, such as identifying roughly 80% of performance bottlenecks. Additionally, AI-powered testing tools can uncover up to 40% more issues during development.
One effective approach Scimus employs is the "Snowplow Strategy", which focuses testing efforts on high-traffic areas that could delay releases, rather than spreading resources thin over low-priority features. By using user data from tools like heatmaps and session replays, Scimus zeroes in on user flows that impact performance the most. This ensures the platform not only meets expectations but also improves user retention. Automated performance checks further enhance the process, alerting teams when response times increase by more than 20%. Monitoring the 95th percentile latency is also crucial - if it exceeds 2 seconds, a significant number of users may leave out of frustration.
Getting Code Audits from Scimus
Once a solid QA process is in place, the next step is conducting a detailed code audit.
"The software audit is the singular essential step. Skipping it is the strategic mistake an organization can make." - Developex
A software audit dives deep into the codebase, architecture, DevOps pipelines, and security protocols to create a clear recovery roadmap. Scimus organizes identified issues by severity - Critical (P0/P1 for immediate fixes), High (P2), Medium (P3), and Low (P4) - to stabilize the system’s core before focusing on new feature development. Their specialized rescue teams address technical debt, such as unstable integrations or inconsistent code patterns, which can otherwise slow down development progress.
The audit also differentiates between immediate causes (like recent deployments) and root causes (such as long-standing issues like poor capacity planning). Recovery typically unfolds in three phases:
- Short-term Stabilization: Focused on mitigating risks within 4–8 weeks.
- Mid-term Refactoring: Aimed at improving test coverage over 3–6 months.
- Long-term Strategy: Involves evolving the architecture for scalability and future growth.
Scimus Service Plans for SaaS Recovery
To address the performance, security, and scalability challenges of SaaS recovery, Scimus offers three service tiers tailored to different needs:
| Plan Name | Best For | Key Features |
|---|---|---|
| Basic Development | Small projects needing foundational QA | Web Development, Mobile App Development, QA Testing |
| Advanced Development | Medium to large platforms requiring stabilization | All Basic features + Web App Development, Automation Testing, Maintenance |
| Enterprise Solutions | Large-scale platforms with complex technical debt | All Advanced features + Blockchain Integration, Industry-Specific Solutions, Dedicated Teams |
For most SaaS recovery situations, the Advanced Development plan stands out. It offers the automation testing and maintenance tools needed to tackle technical debt while building sustainable development practices for the future.
Protecting Your SaaS Platform from Security Threats
After addressing performance issues and quality assurance, the next big step is securing your SaaS platform against threats. Why? Because security is the backbone of customer trust. A whopping 43% of organizations struggle with SaaS configuration challenges as a major security concern. And with data breaches surging by 41.5% in 2022 - affecting over 422 million people worldwide - even a small gap in security can derail recovery efforts for struggling SaaS platforms.
Managing Security Configuration and Risks
Security misconfigurations are a common weak point for SaaS platforms. They often stem from frequent updates or simple human mistakes. These missteps can open the door to data breaches or unauthorized access. One particularly concerning issue is Broken Object-Level Authorization (BOLA). This happens when an API doesn’t properly verify user permissions, allowing attackers to access, expose, or delete sensitive data.
The attack surface grows further with non-human identities like OAuth tokens and API keys, as well as dormant external file shares. These require constant vigilance.
Here’s how to tackle these challenges:
- Use SaaS Security Posture Management (SSPM) tools: These tools monitor configurations, manage user access, and ensure compliance with security standards. They can also uncover misconfigurations and unauthorized data shares, helping identify "Shadow IT" - unsanctioned apps or accounts created outside of centralized identity providers.
- Conduct regular audits: Review and revoke inactive external file shares and permissions like "anyone with the link."
- Secure APIs: Validate and sanitize all inputs to prevent injection attacks.
- Strengthen user identity security: Implement robust access management protocols to reduce vulnerabilities.
Setting Up Identity Access Management (IAM)
In the SaaS world, identity is your first line of defense. A strong IAM setup not only protects user data but also prevents unauthorized access, reinforcing the performance and quality gains you’ve worked hard to achieve.
"Application identity is a critical area for SaaS workloads because it serves as the first line of defense for protecting data." - Microsoft
Start with centralized authentication through Federated Identities (SSO). Services like Google, Okta, or Microsoft Entra allow users to sign in with existing credentials, simplifying the process while boosting security. Add Multi-Factor Authentication (MFA) for an extra layer of protection. Yet, surprisingly, a 2024 study found that no organization had fully implemented MFA across all SaaS accounts.
Beyond authentication, focus on authorization:
- Use Role-Based Access Control (RBAC) to assign permissions based on job roles.
- For more nuanced needs, opt for Attribute-Based Access Control (ABAC).
- Stick to the principle of least privilege, giving users only the access they need to do their jobs.
- For APIs, replace long-term access keys with temporary, limited-privilege tokens.
- Automate processes like account provisioning, permission updates, and access revocation upon employee departure.
Continuous Monitoring for Threat Detection
Once your configurations and identity systems are in place, it’s time to focus on continuous monitoring. Real-time oversight is essential for spotting and neutralizing threats before they escalate.
Start by defining a security baseline - a snapshot of what "normal" looks like for your platform, such as typical login patterns or API usage. This makes it easier to detect unusual activity. Then, centralize logs from various sources into a Security Information and Event Management (SIEM) system for analysis and correlation. Tools like User and Entity Behavior Analytics (UEBA) can help identify anomalies automatically, while external storage for logs ensures you have historical data for reference.
Non-human identities, like service accounts and API keys, deserve special attention. These often outnumber human users and can be exploited if left unmonitored. Keep an eye on DNS queries to spot potential malicious activity and use flow logs to track traffic across subnet boundaries. Finally, integrate your monitoring tools with platforms like Jira or ServiceNow. This way, security deviations can automatically generate tickets, assigning fixes to the right resource owners.
Conclusion: Stabilizing and Improving Your SaaS Platform
Recovering a SaaS platform requires a structured and evidence-based approach. Start with a thorough audit to establish a clear understanding of your current situation - examining the codebase, architecture, DevOps practices, and security measures. This eliminates guesswork and replaces it with actionable insights backed by data. From there, prioritize the most pressing issues, implement immediate fixes (like load balancing or caching), and roll out a phased recovery plan. This plan should focus on short-term wins (within 4–8 weeks), mid-term improvements (over 3–6 months), and long-term growth strategies. Such a systematic approach ensures your recovery efforts are both efficient and sustainable.
"A true, lasting project rescue transcends mere code remediation; it fundamentally repairs the culture and process that enabled the initial failure." - Developex
The stakes are high - ignoring technical debt can quickly stall progress. A successful recovery plan must address multiple challenges at once, such as performance bottlenecks, user experience issues, scalability limitations, and security gaps. Tackling these areas together ensures that each improvement strengthens the overall platform, creating a foundation that can support future growth.
When internal teams are overwhelmed or lack the necessary expertise, partnering with specialists can make all the difference. Expert services like Scimus bring the experience and focus needed to accelerate recovery. Their teams specialize in areas like legacy system analysis, advanced refactoring, and quality assurance. Whether it's conducting in-depth code audits, outsourcing quality assurance, or implementing automation testing, Scimus provides tailored solutions to help you execute your recovery plan efficiently.
FAQs
What should I do first if my SaaS platform is underperforming?
If your SaaS platform isn’t performing as expected, the first step is to clearly identify the issue. Start by observing the symptoms: Is the problem affecting the entire platform or just specific features? Are users encountering errors, slow response times, or both? Determine whether the issue is constant, sporadic, or getting worse over time. It’s also helpful to figure out when the problem first appeared.
Once you’ve outlined the symptoms, dig deeper by collecting data to uncover the root cause. Performance monitoring tools can be invaluable here - track transaction times, database queries, and calls to external services. This will help you define the problem in specific, actionable terms. For example, you might discover that "API response times exceed 2 seconds during peak usage." A well-defined problem sets the stage for effective troubleshooting.
Next, take a closer look at your platform’s architecture and any recent changes. Review your tech stack, integrations, and updates to see if anything might have triggered instability. Combine this information with the performance data to prioritize solutions. Whether it’s optimizing slow code, refining database queries, or resolving issues with third-party services, tackling these problems early can help restore your platform’s stability and avoid further disruptions.
What are the best ways to use monitoring tools to improve SaaS platform performance?
To get the most out of monitoring tools for your SaaS platform, focus on tracking the metrics that truly matter, setting up timely alerts, and diving into trend analysis. Start by identifying key performance indicators (KPIs) that tie directly to your business goals. These might include metrics like response time, error rates, or cost per user. Use monitoring tools to gather data across every layer of your system - from the infrastructure level to the application code - so you can see the full picture of how your platform is performing.
Set up real-time alerts with clear thresholds to catch potential issues early. For example, you might flag response times exceeding 2 seconds or error rates climbing above 1%. When an alert is triggered, dig deeper by correlating logs, metrics, and traces to uncover the root cause. It could be something like a sluggish database query or a server hitting its limit. Reviewing historical data regularly can also help you spot patterns, address recurring problems, and allocate resources more effectively. To take it a step further, you can automate responses to common issues - like scaling up resources or restarting services when certain thresholds are crossed.
These practices can help keep your SaaS platform running smoothly, ensuring it stays fast, dependable, and efficient for your users.
What are the best strategies to efficiently scale my SaaS platform?
Scaling your SaaS platform efficiently begins with designing a flexible, modular architecture. Shifting away from monolithic codebases toward microservices or serverless functions can make a huge difference. These approaches enable automatic scaling, enhance reliability, and minimize the risk of system failures. Leveraging cloud-native tools and infrastructure-as-code lets you scale resources on demand, eliminating the need for manual adjustments.
Adopting DevOps practices is another critical step to ensure stability as your platform grows. Automating tasks like testing, code reviews, and deployments through CI/CD pipelines allows for frequent updates with minimal disruption. Combine this with real-time monitoring tools to catch and address performance issues - such as database bottlenecks or latency spikes - before they affect your users.
Finally, prioritize user experience and front-end performance. Implement cloud hosting with auto-scaling servers, CDN caching, and edge delivery to manage traffic spikes effortlessly. Regularly review your platform for UX enhancements, optimize onboarding processes, and conduct load testing to confirm your infrastructure can handle increased demand without sacrificing performance. Together, these strategies help you scale effectively while maintaining a seamless experience for your users.

