Building Accurate Healthcare Dashboards From PMS and EMR Data
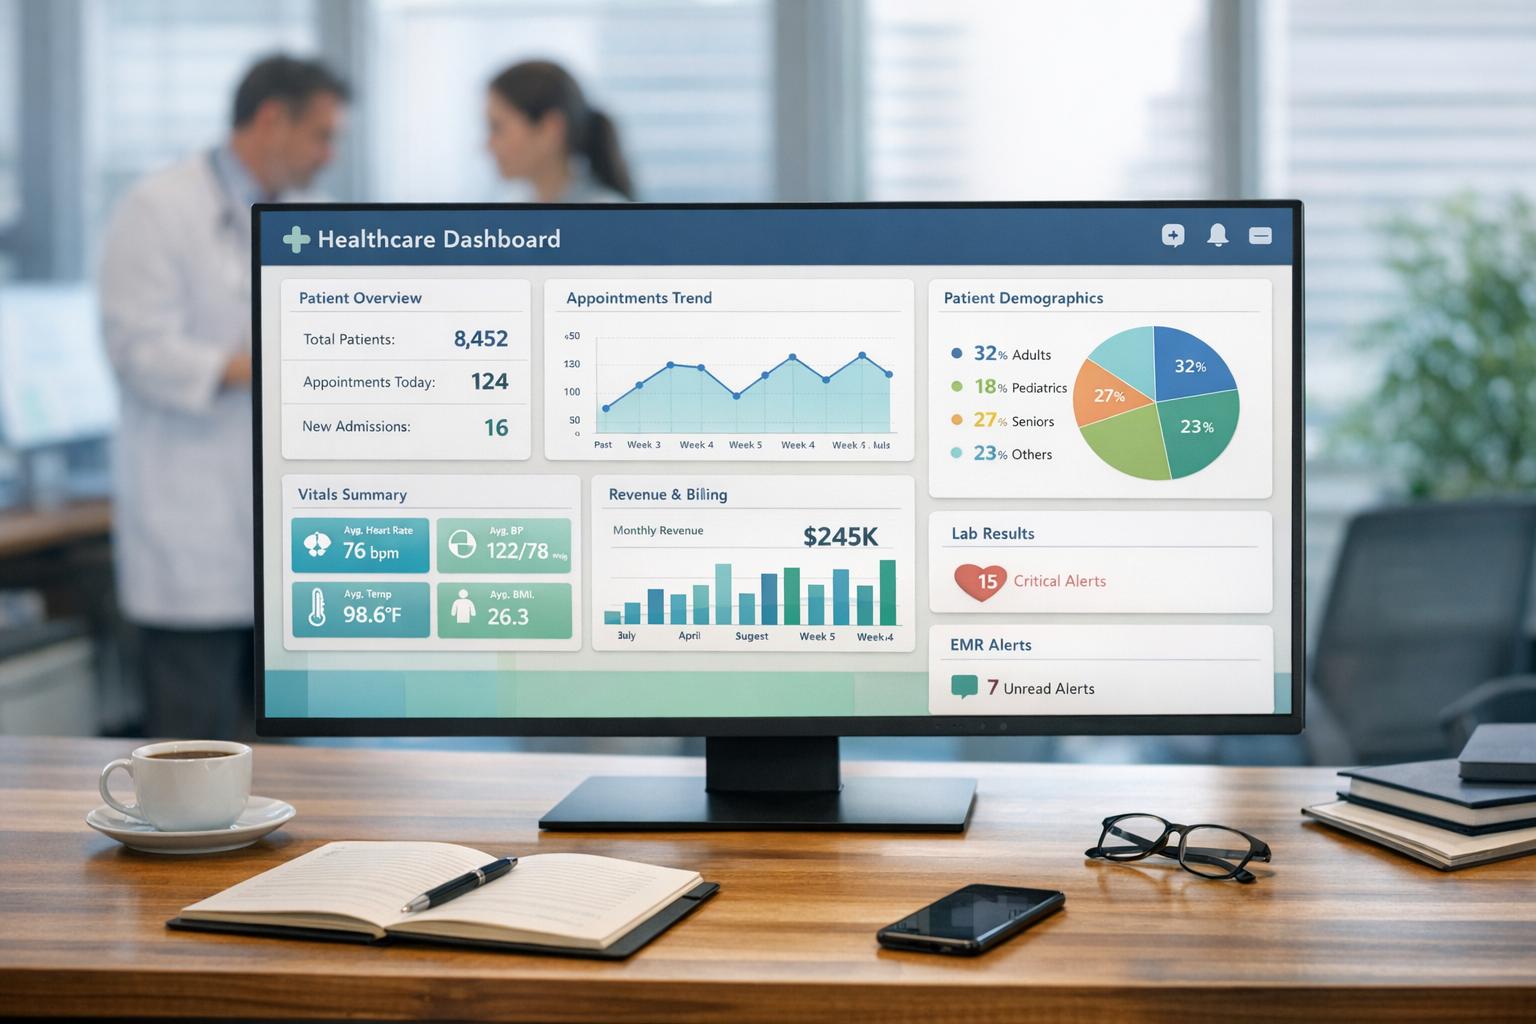
Healthcare dashboards are powerful tools for turning overwhelming amounts of medical and administrative data into actionable insights. By integrating Practice Management Systems (PMS) and Electronic Medical Records (EMR), these dashboards provide a unified view of patient care and hospital operations. However, challenges like inconsistent data formats, security risks, and compliance with regulations make this process complex.
Key Takeaways:
- PMS vs. EMR: PMS manages administrative tasks (scheduling, billing), while EMR focuses on clinical data (patient history, lab results).
- Integration Benefits: Reduces duplication, improves billing accuracy, enhances patient care, and streamlines workflows.
- Challenges: Data silos, inconsistent terminology, and compliance with HIPAA and HITECH regulations.
- Solutions:
Dashboards can improve decision-making, cut costs, and enhance patient outcomes when built on clean, secure, and standardized data. The article explores how to overcome integration hurdles and build reliable, real-time healthcare dashboards tailored to clinical and operational needs.
How to Modernize Healthcare Systems with HL7 & EHR Integration | CapMinds
What is PMS and EMR Data Integration?
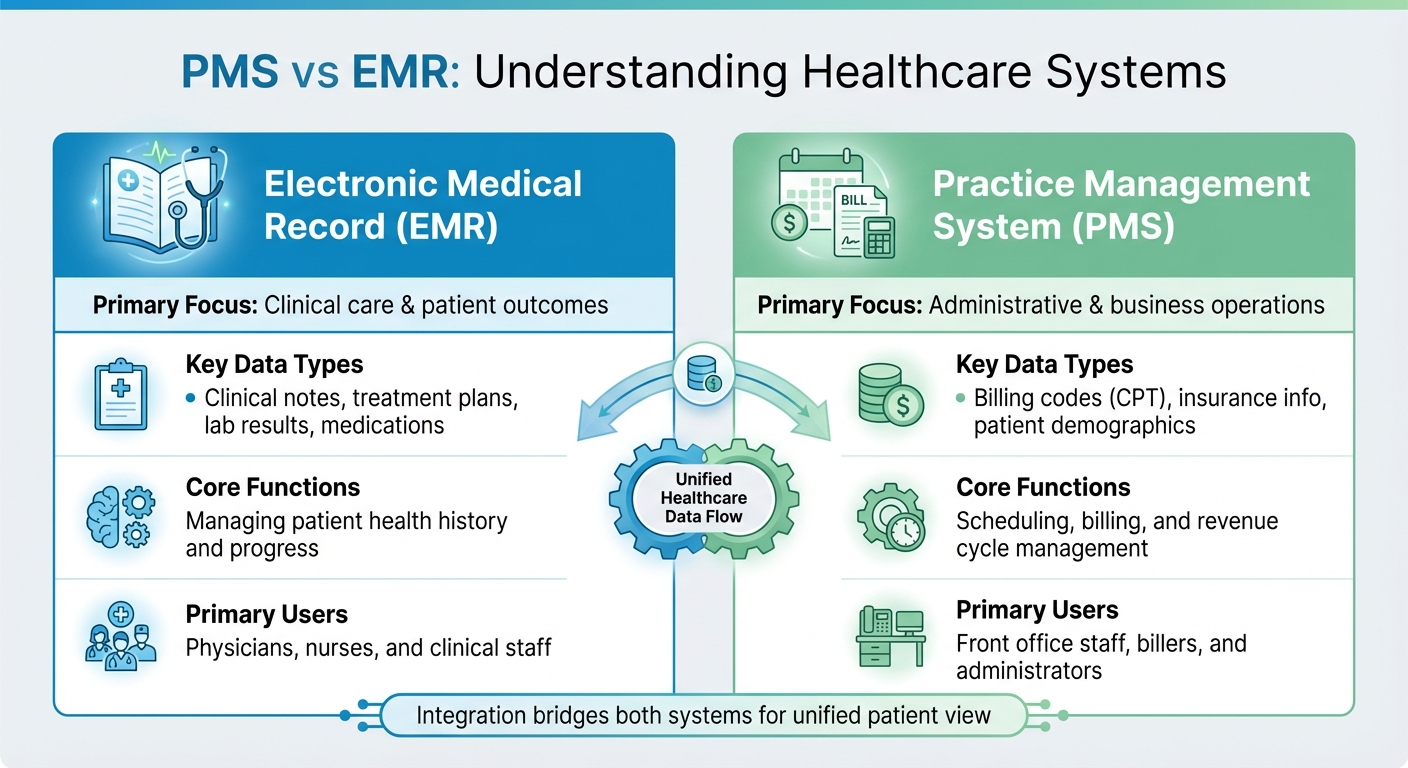
PMS vs EMR Systems: Key Differences in Healthcare Data Management
In the world of healthcare, combining Practice Management Systems (PMS) and Electronic Medical Records (EMR) is essential for creating effective and accurate dashboards. PMS handles the administrative side of healthcare – like scheduling appointments, managing billing, processing insurance claims, and tracking revenue. On the other hand, EMR focuses on clinical data, such as patient histories, treatment plans, lab results, medications, and clinical notes. Think of PMS as the business engine and EMR as the clinical brain. While both systems are critical, they often operate in isolation.
Integration bridges this gap, ensuring a smooth flow of data between administrative and clinical operations. For example, when a patient checks in, their demographic information updates across systems automatically. Similarly, if a physician orders a test, billing codes are generated in real time. Without this integration, staff would need to enter the same data multiple times, leading to inefficiencies and a higher risk of errors. As ClinicTracker puts it:
"When EHR and practice management software don’t talk to each other, it creates inefficiencies… You’re left with information silos that prevent your healthcare practice from running at its best".
This seamless communication depends on interoperability standards like HL7 (Health Level Seven) and FHIR (Fast Healthcare Interoperability Resources), which allow systems from different vendors to connect. These standards are crucial in a market that was valued at $1.05 billion in 2022 and is projected to grow to $3.11 billion by 2030. The message is clear: disconnected systems are no longer viable.
| Feature | Electronic Medical Record (EMR) | Practice Management System (PMS) |
|---|---|---|
| Primary Focus | Clinical care & patient outcomes | Administrative & business operations |
| Key Data Types | Clinical notes, treatment plans, lab results, medications | Billing codes (CPT), insurance info, patient demographics |
| Core Functions | Managing patient health history and progress | Scheduling, billing, and revenue cycle management |
| Primary Users | Physicians, nurses, and clinical staff | Front office staff, billers, and administrators |
Despite their distinct roles, merging PMS and EMR data isn’t without its hurdles.
Common Integration Challenges
Bringing PMS and EMR systems together is no easy task. One of the biggest barriers is the existence of data silos – some healthcare systems still operate with as many as 18 different EHR platforms. Each platform stores data in its own format, making it tough to create a unified view.
Inconsistent data formats add another layer of complexity. As Clearlink Partners explains:
"Preserving data integrity – the accuracy and consistency of data throughout its lifecycle – is often more challenging than people expect".
Compliance with regulations like HIPAA and HITECH further complicates integration. These laws require strict controls on data access, encryption, and audit logging. In 2023 alone, over 540 healthcare organizations reported data breaches affecting more than 112 million individuals. While robust security measures are essential, they can slow down integration projects and drive up costs, which can range from $50,000 to over $200,000 for custom solutions.
Benefits of Combined PMS-EMR Data
When PMS and EMR systems are integrated, the advantages are clear. Workflows become more efficient, eliminating the need for duplicate data entry and freeing up staff time. For instance, in 2025, Dr. Arman Ali at Prime Clinic implemented a combined EMR-PMS system and reduced administrative hours by 25% within three months. The clinic also improved billing accuracy by 30% and saw a 15% boost in patient satisfaction scores.
Patient care also improves significantly. With integrated systems, clinicians gain a complete view of the patient’s history, including clinical details, insurance coverage, and billing records. One study found that integrating EMR systems across primary and specialist care reduced wait times for specialist appointments by an average of 16.5 days. Patients underwent 30.4% fewer medical procedures and 39.6% fewer radiographies because providers had better access to existing test results.
The combination of administrative and clinical data also delivers better operational insights. For example, Queen’s Health Systems used integrated data to identify patients with undiagnosed conditions, enabling proactive care. Similarly, the Mayo Clinic developed a "Patient-360" view across multiple campuses, reducing test duplication and improving diagnostic accuracy. On the flip side, healthcare organizations that fail to adopt integrated data technologies risk losing an estimated $342 billion in revenue. Addressing these challenges is key to building practical and impactful dashboards.
How to Ensure Data Accuracy and Quality
Once you’ve integrated PMS and EMR systems, the next step is ensuring data remains accurate and reliable. Poor data quality doesn’t just slow things down – it directly affects patient care. Consider this: the average cost of a single duplicate patient record is $96, and these duplicates impact 4% of patient care, causing delays in surgeries and redundant lab tests. One healthcare organization managed to reduce its duplicate record rate from 22% to 0.14% by implementing targeted data-cleansing efforts.
With healthcare data expected to grow at a compound annual rate of 36% by 2025, relying on manual checks is no longer practical. Automated tools can catch errors right at the point of entry, while scheduled audits help address issues that build up over time. As Acceldata explains:
"Real-time data validation acts as a gatekeeper, checking for errors, inconsistencies, or missing information as soon as the data is entered".
These steps are essential for maintaining strong data validation processes and setting the foundation for real-time monitoring.
Data Validation and Standardization
Data validation begins the moment information enters the system. Automated checks enforce rules to prevent errors from spreading. For example, a Data Type check would reject "ABC" in a numeric billing field, while a Range check would flag an impossible patient age of 150. Tools like dropdown menus, radio buttons, and checkboxes also help standardize entries, reducing free-text errors. These checks ensure data adheres to specific formats, such as dates following MM/DD/YYYY or amounts being recorded in USD.
For instance, instead of allowing staff to type "broken rib" or "rib fracture" in different ways, a dropdown menu can require them to select a single standardized term. This eliminates semantic mismatches that could confuse dashboards and lead to reporting errors.
ETL (Extract, Transform, Load) pipelines are critical for large-scale data cleansing. These pipelines aggregate data from various sources, resolve inconsistencies, and create a "single source of truth". Automated data-cleansing tools further streamline this process by merging duplicate records and addressing discrepancies without manual effort. In a study comparing automated and manual data extraction, the automated process achieved an agreement rate of 99.0% between variables.
To maintain data integrity, adopt a layered audit strategy: conduct daily checks for missing fields, weekly reviews for duplicates, and monthly audits for broader compliance.
Real-Time Monitoring for Accuracy
While standardization ensures a clean dataset, real-time monitoring keeps it reliable as data flows through dashboards.
Real-time monitoring continuously audits data to ensure accuracy, which is especially crucial for clinical decision-making. Outdated or incorrect data can lead to poor patient outcomes. Real-time integration platforms can trigger alerts when clinical metrics exceed set thresholds, such as vital signs indicating patient deterioration.
An effective technique for maintaining accuracy is rival programming, where an independent process replicates dashboard calculations to verify logic and catch errors. As River Meckstroth from MMS highlights:
"Validation is the best way to ensure that clinical dashboard standards are upheld".
Another best practice is validating data during ingestion. For example, when loading data into tools like PowerBI, use the power query editor to ensure no rows are dropped or improperly merged during transformation. Machine learning algorithms can further enhance monitoring by identifying unusual patterns, such as sudden spikes in medication errors or mismatched patient IDs.
Finally, maintain data lineage tracking to build trust among clinical staff. Record the origin of every metric, how it was transformed, and who approved the logic. This transparency allows users to trace flagged issues back to their source, ensuring accuracy and confidence in the data. By maintaining this level of control, dashboards remain reliable tools for timely and informed clinical decisions.
Tools and Technologies for Integration
Creating reliable healthcare dashboards requires a well-chosen technology stack to seamlessly connect PMS and EMR systems. With fragmented platforms being the norm, robust integration tools are essential. Healthcare data integration typically involves three key components: APIs for secure and efficient data exchange, ETL pipelines for automating data transformation, and visualization platforms for turning raw data into actionable insights. Together, these tools help dismantle data silos and establish a Single Source of Truth (SSOT). Considering healthcare data is growing at an annual rate of 48%, manually managing integration is no longer practical – automation is now a necessity.
The urgency for automation is reflected in the global healthcare data integration market, valued at $1.34 billion in 2023 and expected to grow at a compound annual rate of 14.5% through 2032. This growth is fueled by regulatory demands, the push for real-time analytics, and the rise of AI-powered decision-making tools. In fact, 62% of healthcare organizations identify AI and machine learning as critical to achieving their short-term goals. Below, we explore the technical methods that make this integration possible.
APIs and Interoperability Standards
APIs act as the connectors between PMS and EMR systems, enabling them to exchange data securely without direct database connections. The industry standard for this exchange is HL7 FHIR (Fast Healthcare Interoperability Resources), which uses RESTful APIs and modern web technologies to support real-time data flow. Unlike older HL7 v2 messaging, FHIR is optimized for cloud-based systems and handles both clinical and administrative data seamlessly.
Interoperability standards ensure data retains its meaning across platforms. For instance, when a PMS system sends billing codes to an EMR, FHIR ensures terms like "myocardial infarction" are interpreted consistently, regardless of the software vendor. This semantic interoperability is crucial for accurate reporting and clinical decisions.
A real-world example is the New York eHealth Collaborative. Since 2018, they’ve integrated regional health information exchanges into a statewide network using standardized APIs. This initiative allowed healthcare providers to access patient records and receive real-time alerts directly within their workflows, regardless of the EMR system in use. By eliminating the need for custom integrations between systems, they streamlined operations across the state.
To implement API-based integration effectively, use FHIR for all new projects to ensure compliance with federal regulations and future-proof your systems. Employ standard code sets like SNOMED CT for clinical terms, LOINC for lab results, and RxNorm for medications to avoid data misinterpretation. Additionally, adopt Role-Based Access Control (RBAC) to ensure clinicians access patient-level data while executives view only aggregated insights. While APIs facilitate real-time exchanges, ETL pipelines are essential for consolidating data from diverse systems.
ETL Pipelines for Data Aggregation
ETL (Extract, Transform, Load) pipelines automate the process of pulling data from PMS and EMR systems, transforming it into a standardized format, and loading it into centralized repositories like data warehouses or data lakes.
The transformation phase is where data quality is ensured. ETL pipelines standardize data by converting units, removing duplicates, and unifying terminology, which is critical for accurate reporting and analysis. This clean, consistent data forms the foundation of reliable dashboards.
Modern ETL architectures often leverage Change Data Capture (CDC) to update data in real time, instead of relying on slower, scheduled batch processes. This minimizes the strain on source systems while keeping dashboards current.
For example, a large U.S. healthcare provider with fragmented reporting across Epic and Oracle (Cerner) systems adopted a cloud-based lakehouse architecture on Azure between 2024 and 2025. By using HL7 FHIR standards and automated ETL pipelines, they centralized clinical and financial data, enabling 39 analytics use cases, such as patient transfer dashboards and billing insights. This shift allowed teams to move from manual workflows to self-service analytics using Power BI.
When building ETL pipelines, design them with modularity so individual tools or data sources can be replaced without overhauling the entire system. Include automated validation steps to catch issues like broken data feeds or out-of-range values before they impact dashboards. Resolve terminology conflicts upfront – for example, standardizing definitions for terms like "bed availability" – to ensure consistency across users. With clean data in place, visualization platforms can transform complex datasets into clear, actionable insights.
Visualization and Dashboard Platforms
Once the data is aggregated and standardized, visualization platforms like Tableau and Power BI turn it into meaningful insights. These tools allow organizations to create dashboards that display key clinical and financial metrics. They connect directly to data warehouses, enabling users to build custom views without needing to write code.
Power BI is particularly popular for organizations using Microsoft Azure, as it integrates seamlessly with the Azure ecosystem. Tableau, on the other hand, offers powerful visualization features and works across multiple cloud platforms. Both platforms support real-time data refresh, ensuring dashboards reflect the most current patient and operational metrics.
When choosing a visualization tool, prioritize platforms that support RBAC to control data access based on user roles. Eliminate the need for manual data exports by setting up scalable pipelines that ensure dashboards are always up-to-date. For organizations with unique workflows, custom-built dashboards can be tailored to integrate smoothly with existing PMS and EMR systems while adhering to HIPAA and other regulations.
sbb-itb-116e29a
How to Build Healthcare Dashboards: Step-by-Step
Creating a healthcare dashboard requires more than just linking systems together and hoping for the best. It’s a structured process that begins with data extraction, moves through transformation, and concludes with ongoing validation. The aim? To consolidate fragmented PMS and EMR data into a reliable, unified resource that clinicians, administrators, and executives can count on. Each step tackles specific technical challenges, from pulling data from siloed systems to ensuring the dashboard accurately reflects clinical and operational realities.
Step 1: Extract Data from PMS and EMR
The first step is figuring out what data you need and where it resides. PMS systems typically store information like appointments, billing codes (CMS-1500 forms), and patient demographics, while EMR systems house clinical notes, lab results, medication details, and ICD/CPT codes. With the sheer volume of healthcare data, manual extraction isn’t feasible anymore.
Instead, automate the process using APIs to pull structured data such as appointment schedules and billing records. For unstructured data, Natural Language Processing (NLP) can extract key insights from free-text fields. Intelligent document processing (IDP) tools can achieve accuracy rates of 95–99%, far outpacing traditional OCR systems that hover around 80–90%. To ensure data integrity from the outset, apply clinical-grade validation – like checking that a procedure date isn’t listed before a patient’s birthdate.
"EMR data extraction is the 1st most important step in replacing an EMR." – Access Corp
Once the data is reliably extracted, the next step is to standardize it for analysis.
Step 2: Transform and Map Data
After extraction, the data needs to be standardized to ensure consistency across departments and systems. Address terminology conflicts early so definitions remain uniform. Instead of focusing solely on available data fields, map the data to specific outcomes – like reducing operating room downtime – so it aligns with clinical or business priorities. NLP can also be used here to pull performance metrics from unstructured data, ensuring the granularity needed for analysis at regional, facility, or team levels. Automate quality checks to catch errors, such as out-of-range data or broken feeds, before they reach end-users.
Step 3: Load Data into Dashboards
With clean, standardized data in hand, load it into a centralized repository like a data warehouse or data lake, and connect it to visualization tools like Power BI or Tableau. Design dashboards to meet specific clinical and operational goals. For example, unit managers might need detailed, unit-level data, while executives require broader facility-level trends with drill-down capabilities.
Focus on metrics that directly support high-impact use cases. One health system, for instance, reduced the work hours needed for system updates by 95% by adopting a next-generation data model. Another organization leveraged advanced analytics to cut costs and boost revenue, achieving a net positive margin of over $33 million. Incorporate drill-down features to meet the needs of various stakeholders, and use scalable, automated data pipelines to keep dashboards up-to-date.
Once the data is loaded and organized, the next step is to act on it in real time.
Step 4: Set Up Real-Time Alerts
Real-time alerts are essential for immediate decision-making. Configure alerts for critical metrics such as bed availability, emergency department throughput, or patient deterioration scores (e.g., NEWS2-based alerts). Analytics-driven, facility-wide alerts have been shown to reduce mortality rates for stroke patients by 33.8%.
To enable these alerts, use real-time data processing frameworks like Apache Kafka. Replace slower batch processes with continuous updates, and set thresholds based on clinical or operational benchmarks. Make sure alerts are routed to the appropriate stakeholders – clinicians for patient-level issues and administrators for operational challenges.
Step 5: Validate and Iterate
Validation is not a one-time task; it’s an ongoing process that ensures the dashboard remains accurate and effective. This involves a three-step cycle: validating data ingestion (ETL transformations), checking model integrity (table relationships), and confirming that visualizations accurately represent the data. Between June and August 2023, a research team led by Melina Malkani conducted a usability study involving 218 participants across 10 states. The study, which analyzed 3,259 responses, found that "easy navigation" was the top priority for 96% of participants, while 87% rated "predictive analytics with AI" as highly important.
Use "think-aloud" sessions to gather real-time user feedback and refine dashboard navigation. Monitor usage analytics and employ rival programming to verify that visualizations stay true to the underlying data.
"Designing a healthcare dashboard is an iterative process. Continuously evaluate the effectiveness of your dashboard by seeking feedback from end-users and incorporating their suggestions." – Corine Chartouni, Syntrix Consulting
How to Overcome Common Integration Challenges
Even with solid groundwork, integrating PMS and EMR data often runs into hurdles like outdated systems and inconsistent data entry, which can compromise dashboard functionality. The good news? Most of these issues have practical solutions that don’t involve starting from scratch. Tackling these challenges requires targeted strategies to make integration smoother.
Interoperability and Compliance
A significant roadblock in healthcare data integration is the reliance on legacy systems. Many of these systems, built decades ago, use proprietary formats that don’t easily communicate with one another. This results in isolated data silos and fragile, expensive interfaces. To make matters more complex, healthcare generates around 30% of the world’s data, and in 2023 alone, over 540 organizations reported data breaches affecting more than 112 million individuals. Expanding the integration of systems also increases the risk to Protected Health Information (PHI), making security an absolute priority.
To address these challenges:
- Use industry standards like HL7 FHIR for modern API integrations while continuing to rely on HL7 v2 for older messaging systems.
- Standardize medical terminology with tools like SNOMED CT, LOINC, and RxNorm.
- Strengthen security measures by implementing Role-Based Access Control (RBAC), multi-factor authentication, and end-to-end encryption for both data in transit and at rest.
- Establish clear data governance early on. Define ownership across IT and clinical teams to ensure accountability and smooth operations.
"Healthcare architecture isn’t about chasing the newest tool. It’s about building something that can keep up with operational complexity, regulatory pressure, and constant change without creating fragility or lock-in." – Analytics8
Data Entry and Quality Control
Poor data entry practices can quickly compromise dashboard accuracy. Manual input often leads to errors, redundancies, and inconsistent formats, which ripple through the entire system. In fact, a 2025 survey revealed that 83% of healthcare professionals experienced work disruptions due to incomplete or inaccessible patient data. The solution? Automate data collection wherever possible.
Here’s how to improve data quality:
- Use structured vocabularies and automated ETL (Extract, Transform, Load) processes to reduce human error and ensure consistent data formatting.
- Create a centralized data warehouse with standardized formats to cut down processing times and avoid duplication.
- Provide specialized training for different roles and implement access controls to minimize mistakes.
- Keep dashboards focused by tracking 15–25 key performance indicators (KPIs) to avoid overwhelming users. Research also shows that people can process only about seven visual elements at a time, so a minimalist design is essential.
"Terminology standards address a fundamental requirement for effective communication – the ability to represent concepts in an unambiguous manner between a sender and receiver of information." – HIMSS
Performance Tracking and Maintenance
Building a dashboard is just the beginning. To ensure long-term success, continuous performance tracking and maintenance are crucial. Displaying data over a period of two or more years at regular intervals can help uncover trends and measure operational impact. For example, the industry average for patient mortality rates is approximately 2%, while insurance claims denial rates should remain below 5%.
To maintain an effective dashboard:
- Break data into meaningful subcategories, such as by provider, department, or office, to identify areas of excellence and those needing improvement.
- Incorporate interactive features like drill-down capabilities, real-time notifications, and automated ETL pipelines to spot outliers, analyze their causes, and ensure data is consistently updated.
- Maintain a metrics dictionary for each KPI, detailing its definition, formula, target, and source, to ensure everyone interprets the data the same way.
- Regularly update dashboard categories and fields based on new clinical developments and feedback from stakeholders to keep the tool relevant.
"Governance shouldn’t be a barrier to using data. It should be the reason your teams trust the data." – Analytics8
Examples of Healthcare Dashboards
Case studies highlight how integrating Practice Management Systems (PMS) and Electronic Medical Record (EMR) data can reshape operational workflows and enhance clinical decision-making. These dashboards go beyond basic reporting by delivering actionable insights that improve patient care and streamline facility operations. Let’s dive into some examples to see the real-world impact of this integration.
Operational Efficiency Dashboards
Operational dashboards combine scheduling, billing, and resource data from PMS with clinical throughput information from EMR systems. For instance, in 2024, a single-provider clinic in Texas adopted a cloud-based system with automated appointment reminders and digital intake forms. Within just 60 days, the clinic reduced its no-show rate by 31% and enabled physicians to complete daily charting before leaving, thanks to auto-filled fields and speech-to-text features.
At a 400-bed regional hospital, the implementation of a PMS with HL7 compatibility across surgery, ICU, and pharmacy departments led to dramatic improvements. Patient discharge times dropped from 6–8 hours to under 2 hours, and task dashboards for provider handoffs reduced miscommunication events by nearly 40%. Similarly, AyurVAID Hospitals in India tracked 18,000 patients and automated the management of over 750 items, resulting in a 35% revenue increase in two years and 45% by the third year.
"Clinicians save up to 30% of their time when key data is centralized." – Folio3
These examples show how operational dashboards can streamline processes and free up valuable time for healthcare providers.
Clinical Outcome Dashboards
Clinical dashboards prioritize patient safety and treatment effectiveness by monitoring real-time health indicators. Between 2019 and 2022, Barts Health NHS Trust implemented a deteriorating patient dashboard across five academic hospitals, including Royal London and St Bartholomew’s. Using Qlik Sense to visualize EHR data from Cerner Millennium, the trust tracked National Early Warning Scores (NEWS2) and SBAR (Situation-Background-Assessment-Recommendation) handovers. As a result, NEWS2 compliance rose from 64% to 83%, and completed SBAR referral forms surged from 170 to 6,800 monthly during the evaluation phase.
Mayo Clinic’s emergency departments introduced the "YES Board" dashboard to provide real-time updates on patient locations and treatment progress. This system reduced average ER stays by 30 to 60 minutes, according to internal assessments. Meanwhile, Cleveland Clinic’s Neurological ICU developed an infection tracking dashboard that integrated real-time lab data and nursing documentation, enabling a multidisciplinary "tackle team" to significantly reduce hospital-acquired infections.
"Healthcare dashboards are concise, time-saving and intuitive tools for up-to-date assessment and escalation auditing of deteriorating patients." – Baneen Alhmoud et al., Institute of Health Informatics
These clinical dashboards demonstrate how integration can improve patient outcomes while also supporting operational goals.
Before and After Integration Metrics
The benefits of PMS-EMR integration are evident when comparing performance metrics before and after implementation. These improvements span patient engagement, operational efficiency, and clinical quality:
| Metric | Before Integration | After Integration |
|---|---|---|
| Patient No-Show Rate | Manual tracking | 31% reduction |
| Hospital Discharge Time | 6–8 hours | Less than 2 hours |
| Emergency Dept. Stay | Baseline | 30–60 minute reduction |
| Redundant Diagnostics | High/Fragmented systems | 22% reduction |
| Resource Utilization | Baseline | 20–25% improvement |
| Revenue Growth (Year 2) | Baseline | 35% increase |
| Follow-up Adherence | Baseline | 19% improvement |
These metrics highlight the measurable advantages of integration, from financial growth to improved patient care. The key to success lies in identifying the right KPIs for your organization and monitoring them consistently over time.
Conclusion
Creating accurate healthcare dashboards from PMS and EMR data has a profound impact on both operations and patient care. By integrating clinical records with billing and administrative systems, healthcare providers can establish a unified patient view. This eliminates data silos and empowers clinicians to make quicker, more informed decisions. The results speak for themselves: hospitals have reported annual savings ranging from $160,000 to $10.7 million, reduced surgery complication rates by 9.4%, and a 29% drop in adverse events – all through effective dashboard implementation.
The cornerstone of any successful dashboard is data accuracy. With 90% of U.S. physicians now using EHR systems, ensuring data quality has become the backbone of modern healthcare. For example, standardizing lab data alone has been shown to reduce medication errors by 30%. Without clean, reliable data, even the most advanced dashboard cannot deliver meaningful results.
"Healthcare data integration is not just an advantage; it’s a necessity for advancing patient-centered care and fostering a more resilient, data-driven healthcare environment." – Lumenalta
This necessity is further emphasized by market trends. The healthcare data integration market reached $1.34 billion in 2023 and is expected to grow at an annual rate of 14.5% through 2032. Real-time insights have become essential for tracking metrics like bed occupancy rates, infection trends, and revenue cycle optimization. Dashboards built on modern standards such as FHIR and HL7 not only streamline clinical workflows but also support the shift toward value-based care.
At Scimus, these principles are at the heart of our approach. We specialize in building custom healthcare solutions that bridge PMS and EMR systems through proven strategies for data integration and validation. Our development teams collaborate with healthcare providers to design dashboards tailored to specific clinical and operational needs, all while adhering to strict HIPAA compliance. From automated workflows to real-time monitoring systems, we transform fragmented data into a single source of truth that improves patient outcomes and operational efficiency.
Looking ahead, focus on interoperability, establish robust data governance early, and collaborate with experienced teams who understand the technical and regulatory challenges of healthcare integration. Remember, the effectiveness of your dashboard depends on the quality of the data it displays and the actionable insights it provides.
FAQs
How does integrating PMS and EMR systems enhance patient care?
Integrating Practice Management Systems (PMS) with Electronic Medical Records (EMR) plays a key role in improving patient care. This connection gives healthcare providers real-time access to detailed and accurate patient information, enabling quicker and more informed clinical decisions that can lead to better treatment results.
Beyond clinical benefits, this integration simplifies workflows, minimizes administrative mistakes, and strengthens communication among care teams. By merging operational and clinical data, providers can offer more efficient and tailored care, enhancing the overall experience for patients.
What challenges arise when integrating data from Practice Management Systems (PMS) and Electronic Medical Records (EMR)?
Integrating data from PMS and EMR systems isn’t always straightforward. One of the biggest obstacles is dealing with fragmented data stored in isolated silos, making it tough to bring everything together. On top of that, inconsistent formats can make harmonizing the information a real headache, and poor data quality only adds to the risk of inaccuracies creeping in. If that wasn’t enough, older legacy systems often lack the ability to support modern integration techniques, making the process even more challenging.
Then there’s the issue of security risks and the lack of interoperability between systems, which can make seamless data exchange feel like an uphill battle. Tackling these problems calls for a solid game plan – think advanced integration tools, enforcing strict data governance policies, and encouraging close collaboration between IT and healthcare teams. Together, these strategies can help smooth out the bumps in the road.
What are the key tools and technologies needed to create accurate healthcare dashboards?
Creating precise healthcare dashboards involves leveraging a mix of advanced tools and technologies. Key elements include data integration platforms that work seamlessly with APIs and healthcare standards like FHIR, as well as cloud-based data storage solutions such as data warehouses or lakehouses to manage large datasets effectively. To simplify and accelerate data processing, automated ETL/ELT pipelines are essential.
Equally important are data governance and quality management tools to maintain accuracy and ensure compliance with regulations. Meanwhile, AI-driven analytics and visualization tools play a vital role in converting raw data into meaningful, actionable insights. Together, these technologies empower healthcare providers with dependable, easy-to-use dashboards that enhance decision-making and streamline operations.